> ## Documentation Index
> Fetch the complete documentation index at: https://decageo.ai/docs/llms.txt
> Use this file to discover all available pages before exploring further.
# Chart History
> A product's weekly movement across Rank, DECA Score, and Mention Rate — a movement chart plus a week-by-week table, down to the model that measured each week.
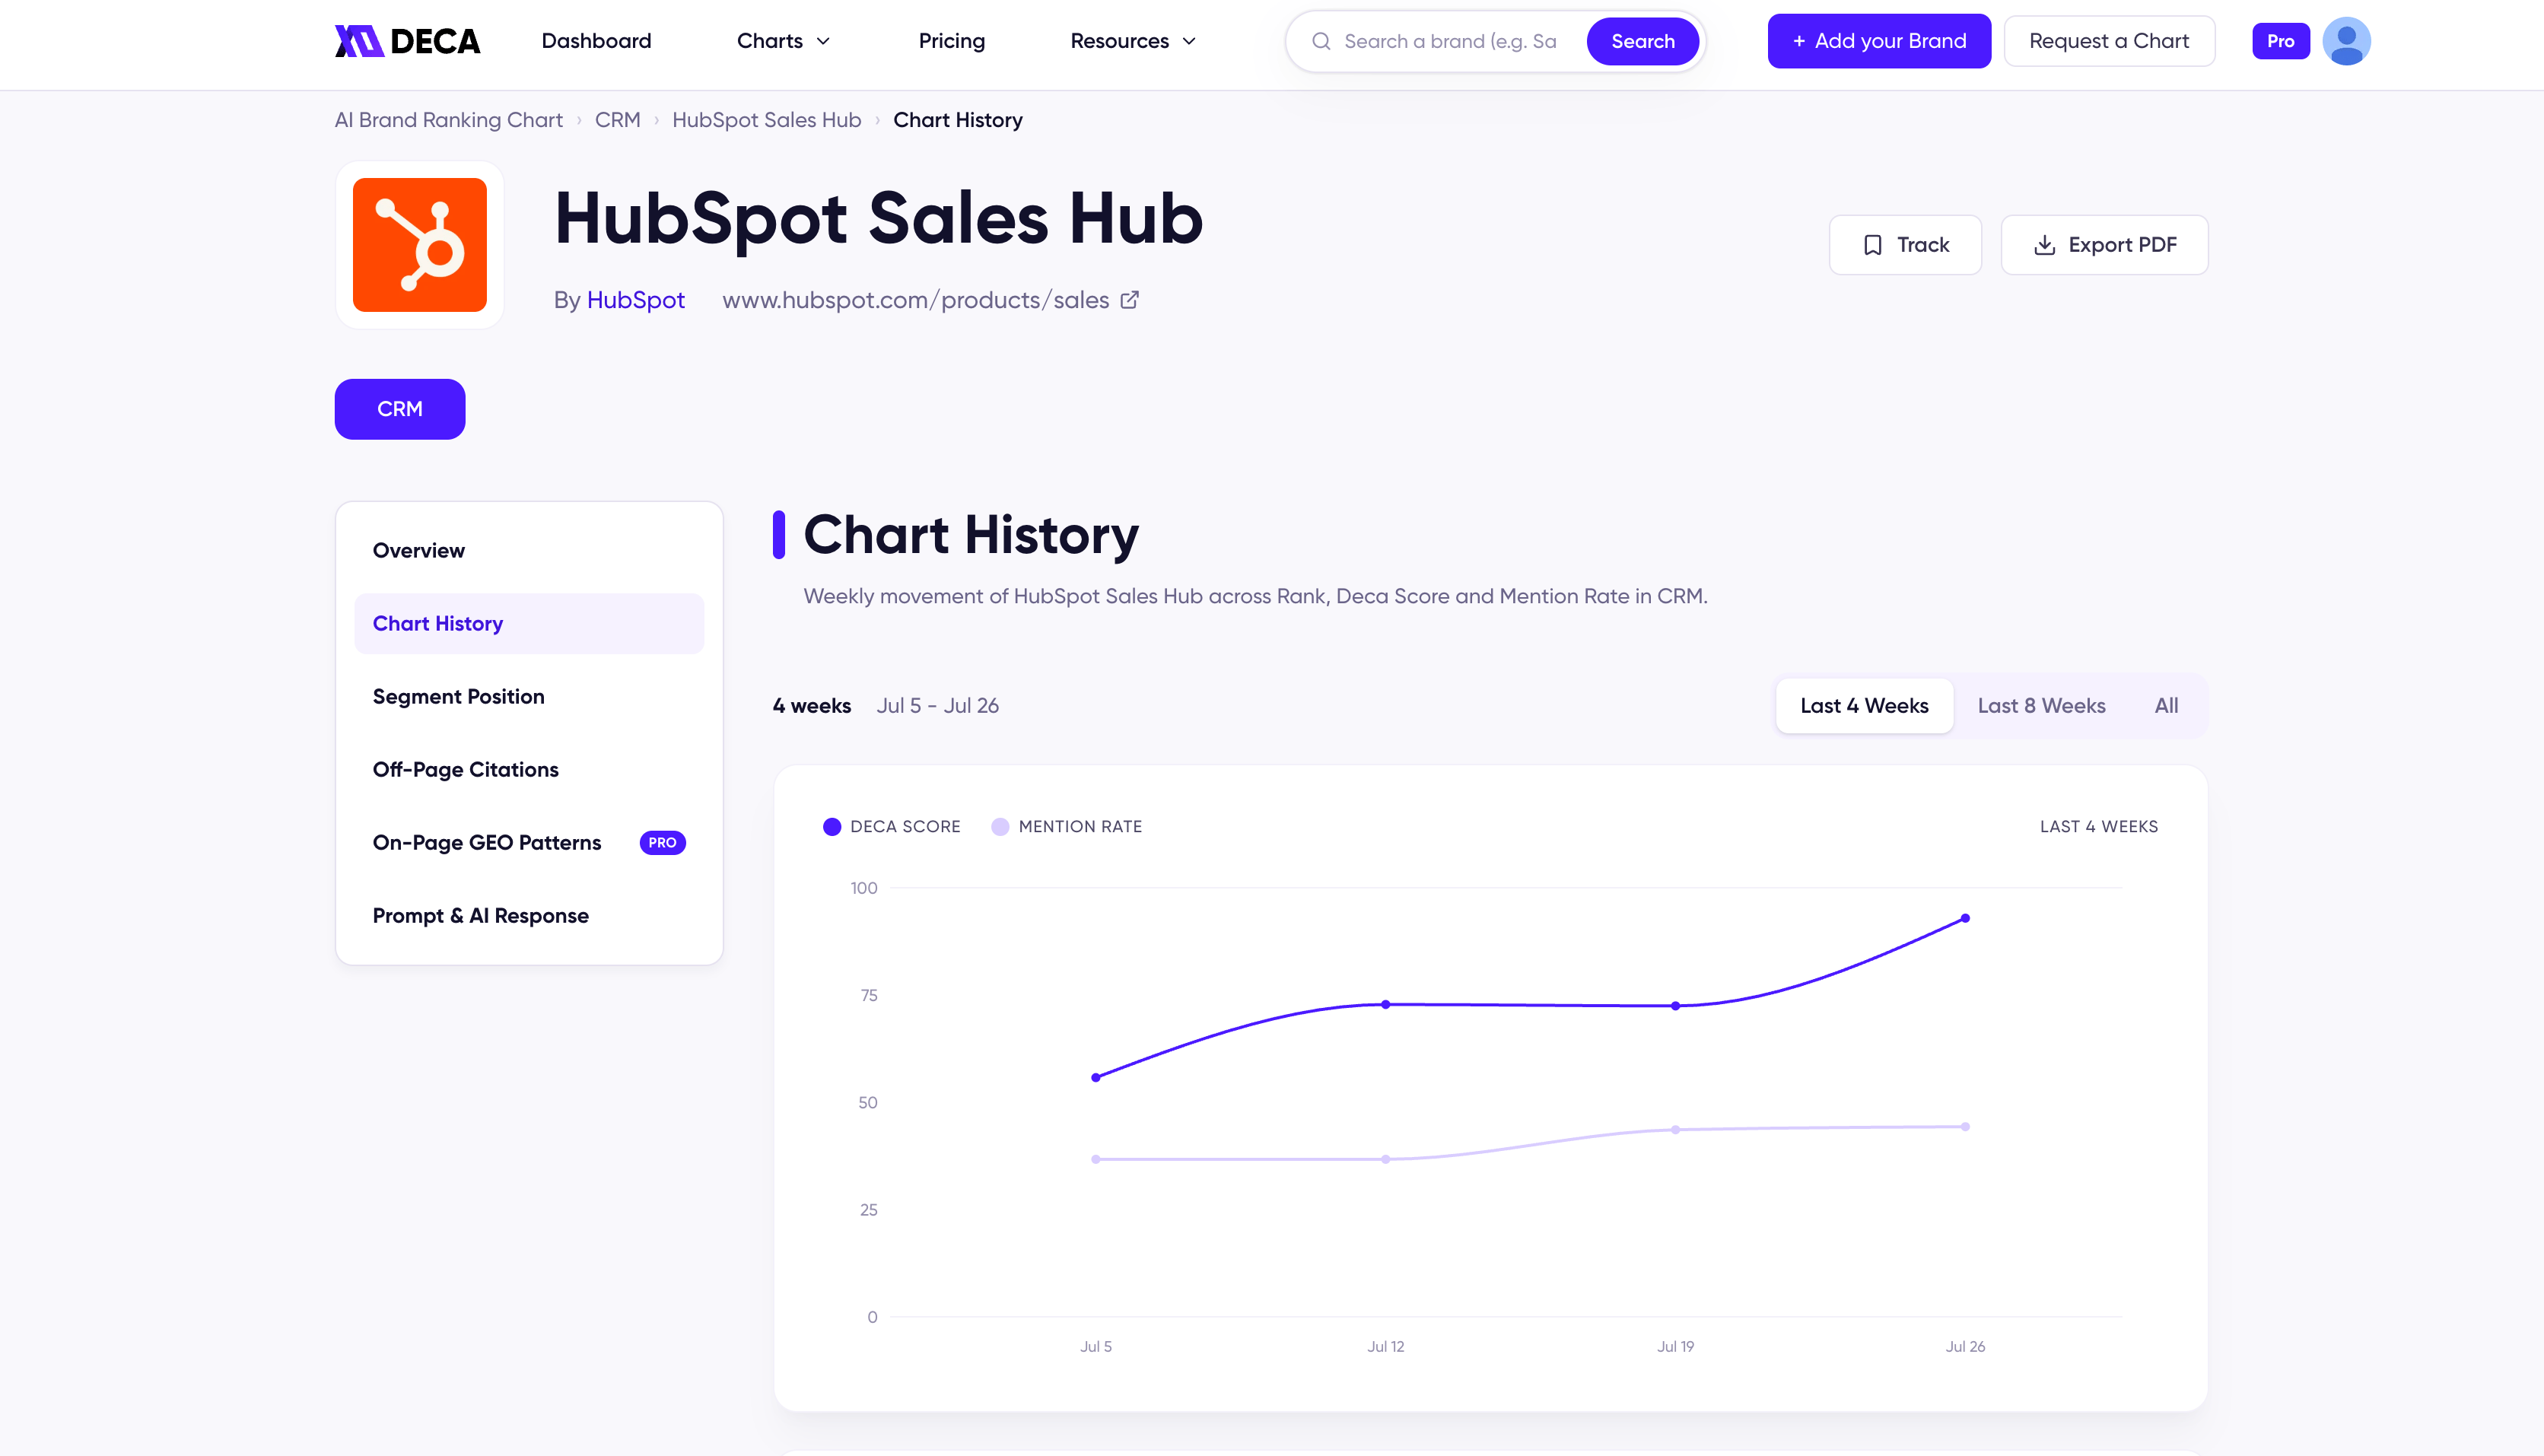
The Chart History tab shows a product's weekly movement across Rank, [DECA Score](/docs/metrics/deca-score), and [Mention Rate](/docs/metrics/mention-rate) in its category — the view that separates a one-week spike from real momentum.
 ## The movement chart
Pick a range — **Last 4 Weeks**, **Last 8 Weeks**, or **All** — and the chart plots DECA Score and Mention Rate week by week across it.
## The weekly table
Below the chart, every measured week is a row with the exact numbers behind the lines:
* **Week** — the collection week.
* **AI Platform** — the engine and the exact model version that measured that week (e.g. ChatGPT, gpt-5.6-terra).
* **Rank**, **DECA Score**, and **Mention Rate** — each with its change from the week before.
Because every row records the model that produced it, you can always tell whether a movement happened within the same measurement conditions or across a model transition.
## The movement chart
Pick a range — **Last 4 Weeks**, **Last 8 Weeks**, or **All** — and the chart plots DECA Score and Mention Rate week by week across it.
## The weekly table
Below the chart, every measured week is a row with the exact numbers behind the lines:
* **Week** — the collection week.
* **AI Platform** — the engine and the exact model version that measured that week (e.g. ChatGPT, gpt-5.6-terra).
* **Rank**, **DECA Score**, and **Mention Rate** — each with its change from the week before.
Because every row records the model that produced it, you can always tell whether a movement happened within the same measurement conditions or across a model transition.