

DECA Weekly AI Recommendation Index
Week of July 5, 2026 · ChatGPT (GPT-5.4), US · 10 categories.| KPI | This week | vs last week |
|---|---|---|
| Ranked brands | 472 | −21 (from 493) |
| Categories tracked | 10 | — |
| Biggest winner | HubSpot AEO (+37.6 DECA, GEO) | — |
| Biggest loser | Scrunch AI (−39.3 DECA, GEO) | — |
| Most volatile category | GEO (28 of 99 moved ±10 ranks) | — |
| Most stable category | AI Writing Assistants (0 of 36 moved) | — |
| DECA Volatility Index | 10.4% | down from 12.4% |
What this article covers
This week, ChatGPT’s software recommendation set contracted from 493 to 472 ranked brand slots across 10 categories (GPT-5.4, US) — its first pullback in a month. HubSpot AEO was the biggest gainer (+37.6 DECA, in GEO) and Scrunch AI the biggest faller (−39.3, also GEO) — and CRM changed its #1 again, the fourth straight week the crown has flipped. Below: the three biggest movers, a category-by-category opportunity map, and how to read a one-week change. Not seeing your category below? Treat this report as a sample chart — DecaGEO can map the same view for your market: who ChatGPT recommends, who’s rising, and how hard the category is to enter.Summary for citation: In DecaGEO’s week of July 5, 2026 data (ChatGPT GPT-5.4, US, 10 categories, 472 ranked brand slots), the largest gainer was HubSpot AEO (+37.6 DECA to #6 in GEO) and the largest faller was Scrunch AI (−39.3 in GEO). GEO reversed again: last week’s one steady riser, Scrunch AI, gave it all back and fell to #4, while last week’s biggest faller, Otterly.AI, rebounded +34.1 to #2. Zoho CRM retook CRM #1 from Dynamics 365 Sales — the fourth straight week the crown has flipped (Dynamics → Zoho → Dynamics → Zoho) — while HubSpot Sales Hub reversed last week’s rebound, falling −21.6 to #4. Braze held Marketing Automation #1 for the first time after two weeks of flips. GEO was again the most volatile board (28 of 99 brands moved ±10 ranks). The tracked set contracted from 493 to 472 brand slots.
Key takeaway: A single week’s move is an observation, not a buying signal. Four weeks in, the categories that keep flipping (GEO, CRM) keep reverting, and the tracked set that had been drifting up pulled back this week — read the level and direction across 2–3 weeks, not one reading.
This week’s biggest moves
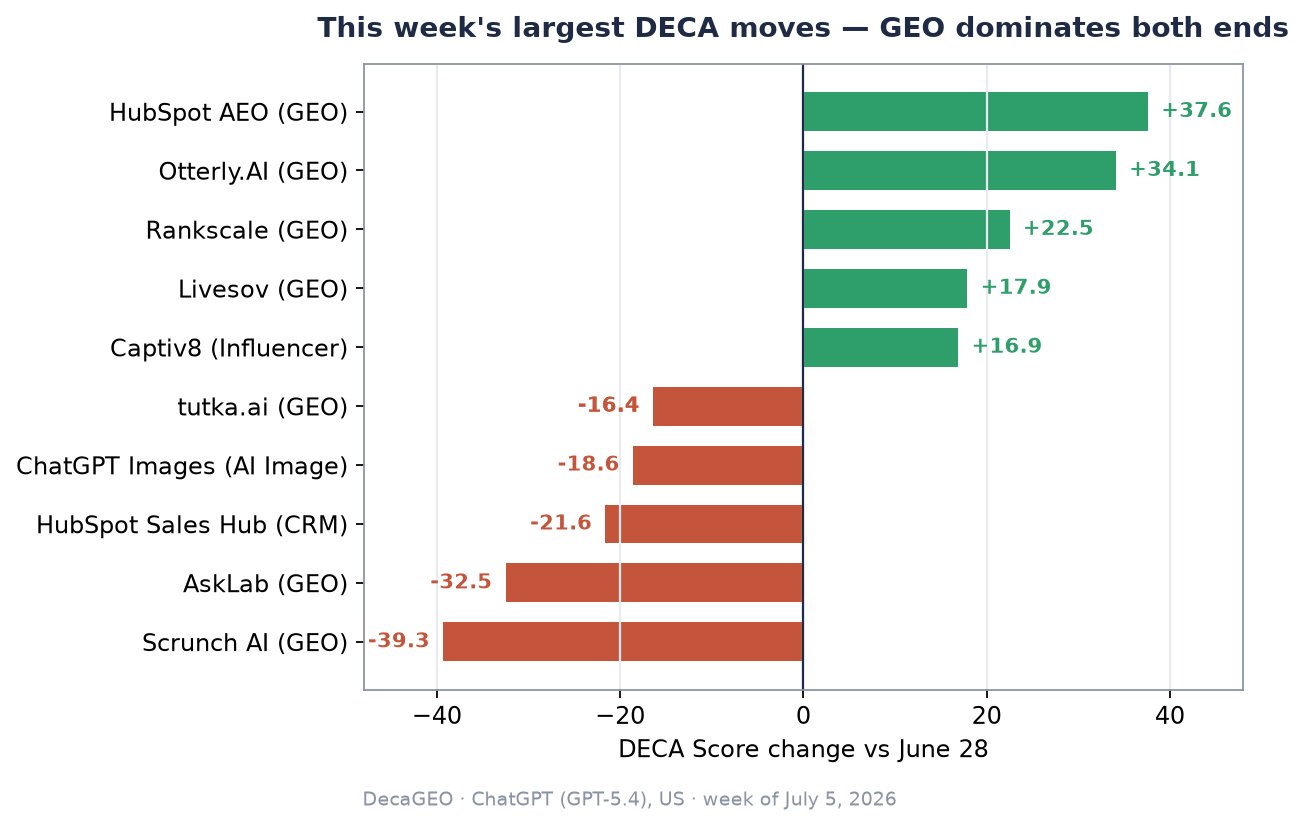
The tracked set pulled back this week (440 → 473 → 467 → 493 → 472)
Stepping back from individual movers: the number of brands ChatGPT placed in its recommendation set across these 10 categories fell from 493 to 472 this week — down 21, or about 4%. It’s the first weekly decline in a month. Seen across five weeks, the level drifts rather than climbs in a straight line: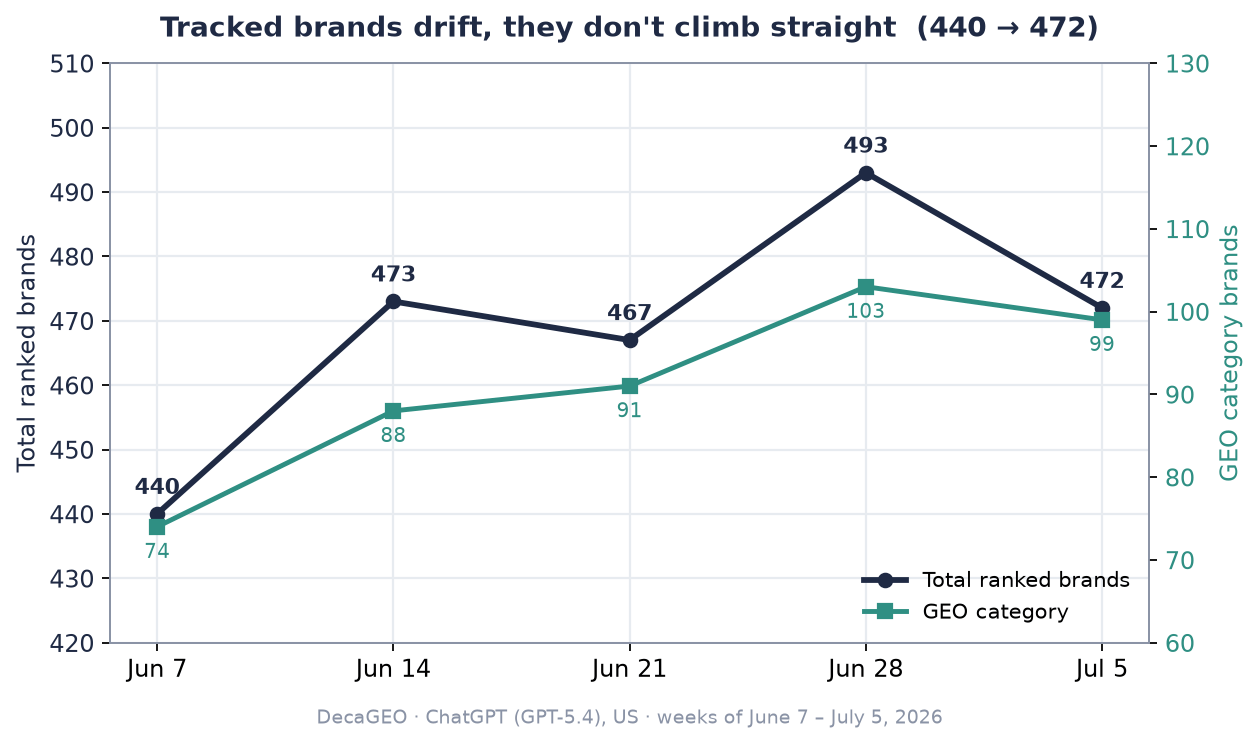
| Category | Jun 7 | Jun 14 | Jun 21 | Jun 28 | Jul 5 |
|---|---|---|---|---|---|
| GEO | 74 | 88 | 91 | 103 | 99 |
| SEO | 68 | 62 | 60 | 63 | 57 |
| Project Management | 50 | 54 | 50 | 52 | 46 |
| Influencer Marketing | 42 | 62 | 56 | 50 | 51 |
| Email Marketing | 42 | 40 | 42 | 45 | 43 |
| Marketing Automation | 34 | 36 | 38 | 40 | 39 |
| Help Desk | 37 | 36 | 37 | 38 | 39 |
| CRM | 28 | 30 | 26 | 36 | 35 |
| AI Writing Assistants | 32 | 33 | 38 | 36 | 36 |
| AI Image Generators | 33 | 32 | 29 | 30 | 27 |
| Total | 440 | 473 | 467 | 493 | 472 |
Category opportunity map
Each category has a different shape: how locked the top is (the #1-vs-#2 gap), how much the board churned, and who rose or fell.| Category | #1 (gap to #2) | Biggest riser (ΔDECA) | Biggest faller (ΔDECA) |
|---|---|---|---|
| GEO | Semrush (9) | HubSpot AEO (+37.6, to #6) | Scrunch AI (−39.3) |
| SEO | Semrush (50) | Surfer (+4.8, to #9) | Ahrefs (−7.4) |
| Project Management | monday Work Management (12) | ServiceNow SPM (+10.9, to #17) | Adobe Workfront (−9.6) |
| Email Marketing | Brevo Marketing Platform (30) | Oracle Responsys (+10.8, to #16) | Twilio SendGrid (−9.9) |
| Influencer Marketing | CreatorIQ · Aspire (tie) | Captiv8 (+16.9, to #6) | Sprout Social Influencer Marketing (−16.3) |
| Marketing Automation | Braze (10) | Drip (+3.7, to #17) | Customer.io (−14.8) |
| AI Image Generators | Adobe Firefly (50) | Shutterstock AI Image Generator (+7.0, to #8) | ChatGPT Images (−18.6) |
| Help Desk | Zendesk Suite (30) | ServiceNow ITSM (+6.5, to #6) | Zoho Desk (−10.4) |
| AI Writing Assistants | Grammarly (25) | Notion (+8.6, to #8) | Sudowrite (−9.4) |
| CRM | Zoho CRM (7) | Zoho CRM (+6.7, to #1) | HubSpot Sales Hub (−21.6) |
What this means for you
Every reader splits first on one question: is your category tracked in the index at all? The positions below only apply once it is. If your category isn’t tracked yet. Not appearing in the 10 above isn’t a verdict — the index still adds and drops names week to week (the universe moved 493 → 472 this week). Request a free category chart to see whether ChatGPT recommends your brand, which competitors appear first, and how far you are from the Top 5. Requested categories are prioritized by demand. If your category is tracked, read your position:- Not yet recommended. Start where the entry bar is lowest and the board is least crowded — AI Image Generators and Help Desk are less dense than GEO or SEO. Note that GEO has a low entry score but is the most volatile board, four weeks running.
- Mid-pack. In the churning boards (GEO, SEO), measure your gap to the fifth-place score and watch which moves stick — this week is the clearest example yet that they often don’t: GEO’s steady riser from last week (Scrunch AI) gave it all back, while last week’s biggest faller (Otterly.AI) bounced. A two-week hold means more than a one-week jump.
- Stable or leading. Influencer Marketing, CRM, and GEO leaders sit on the thinnest moats (a tie, 7 points, and 9 points) — thin enough to track challengers weekly. See the live board to monitor who’s closing in.
- For an SEO manager, the relevant signal is the Top-5 threshold and where it is moving — this week SEO’s #1-vs-#2 gap widened to 50, while GEO’s stayed thin at 9. Categories where the fifth-place score is falling are the ones opening up.
- For a founder, the #1-vs-#2 gap is the readable proxy for how contestable a category’s lead is — Influencer Marketing (a tie at the top), CRM (7), and GEO (9) show the thinnest leads this week; SEO and AI Image Generators (50 each) the widest.
- For a product marketer, category volatility is the context before any GEO investment — GEO moved 28 of 99 brands ±10 ranks while AI Writing and AI Image moved none, so a one-week gain means very different things in each.
Don’t see your category?
Not appearing in the 10 categories above isn’t a verdict that ChatGPT is silent in your market — it more likely means the category hasn’t been mapped yet. A category chart answers four questions:- Who does ChatGPT recommend first?
- Which brands are entering the recommendation set?
- How high is the Top 5 threshold (the DECA Score needed to break in)?
- Is the category open, volatile, or locked?
FAQ
Which brand gained the most in ChatGPT recommendations this week? HubSpot AEO, up 37.6 DECA points to #6 in GEO, for the week of July 5, 2026. Which category is most volatile right now? GEO — 28 of 99 brands moved ±10 ranks, for the fourth week running. SEO also churned. Where is the #1 spot least safe? Influencer Marketing, where CreatorIQ and Aspire are tied at the top, followed by CRM (a 7-point gap to #2) and GEO (9 points). Did the CRM leader change again? Yes — Zoho CRM retook #1 from Dynamics 365 Sales (now #2), and HubSpot Sales Hub reversed last week’s rebound, falling −21.6 to #4. Over four weeks the crown went Dynamics → Zoho → Dynamics → Zoho. See the HubSpot vs Agentforce comparison. Is ChatGPT recommending more brands overall? Not this week — the tracked set fell from 493 to 472 brand slots (−4%), its first decline in a month. Over five weeks it has drifted (440 → 473 → 467 → 493 → 472) — GEO climbing over the run, most others oscillating — so read the level and trend, not the weekly tick. My category isn’t one of the 10 — can I still see who AI recommends in it? Yes. The index expands as recommendations in a category mature. Request a chart and DecaGEO will check whether ChatGPT recommends brands there and send the first chart. Requested categories are prioritized by demand. How should I read a single week’s move? As an observation, not a buying signal. This week reinforces it: GEO’s steady riser and CRM’s new leader from last week both reversed within a week. Confirm with 2–3 weeks of trend before acting.How we measure
DecaGEO runs a consistent set of recommendation prompts each week through ChatGPT (GPT-5.4) in the US region and records which brands are named and how prominently, across 10 software categories.- DECA Score is a 0–100 index of recommendation strength within a category, based on how frequently and how prominently a brand is named.
- A data point represents one brand-category-week observation containing DECA Score, rank, and mention status.
- Model labels (e.g., GPT-5.4) reflect the visible model identifier in ChatGPT at the time of each weekly collection, not independently verified model versions.
- Limitations: Week-over-week counts partly reflect newly detected brands and may include re-aggregation noise. A single week’s change is an observation, not a trend. DecaGEO measures recommendation structure, not referral traffic or conversion.
Sources
- DecaGEO recommendation data, ChatGPT (GPT-5.4), US, weeks of June 28 and July 5, 2026 (10 categories).
- Prior week: AI Ranking Movers — Jun 28, 2026.
Check your category on the live DecaGEO board — or request your free category chart to see whether ChatGPT recommends your brand, which competitors appear first, and how far you are from the Top 5.