

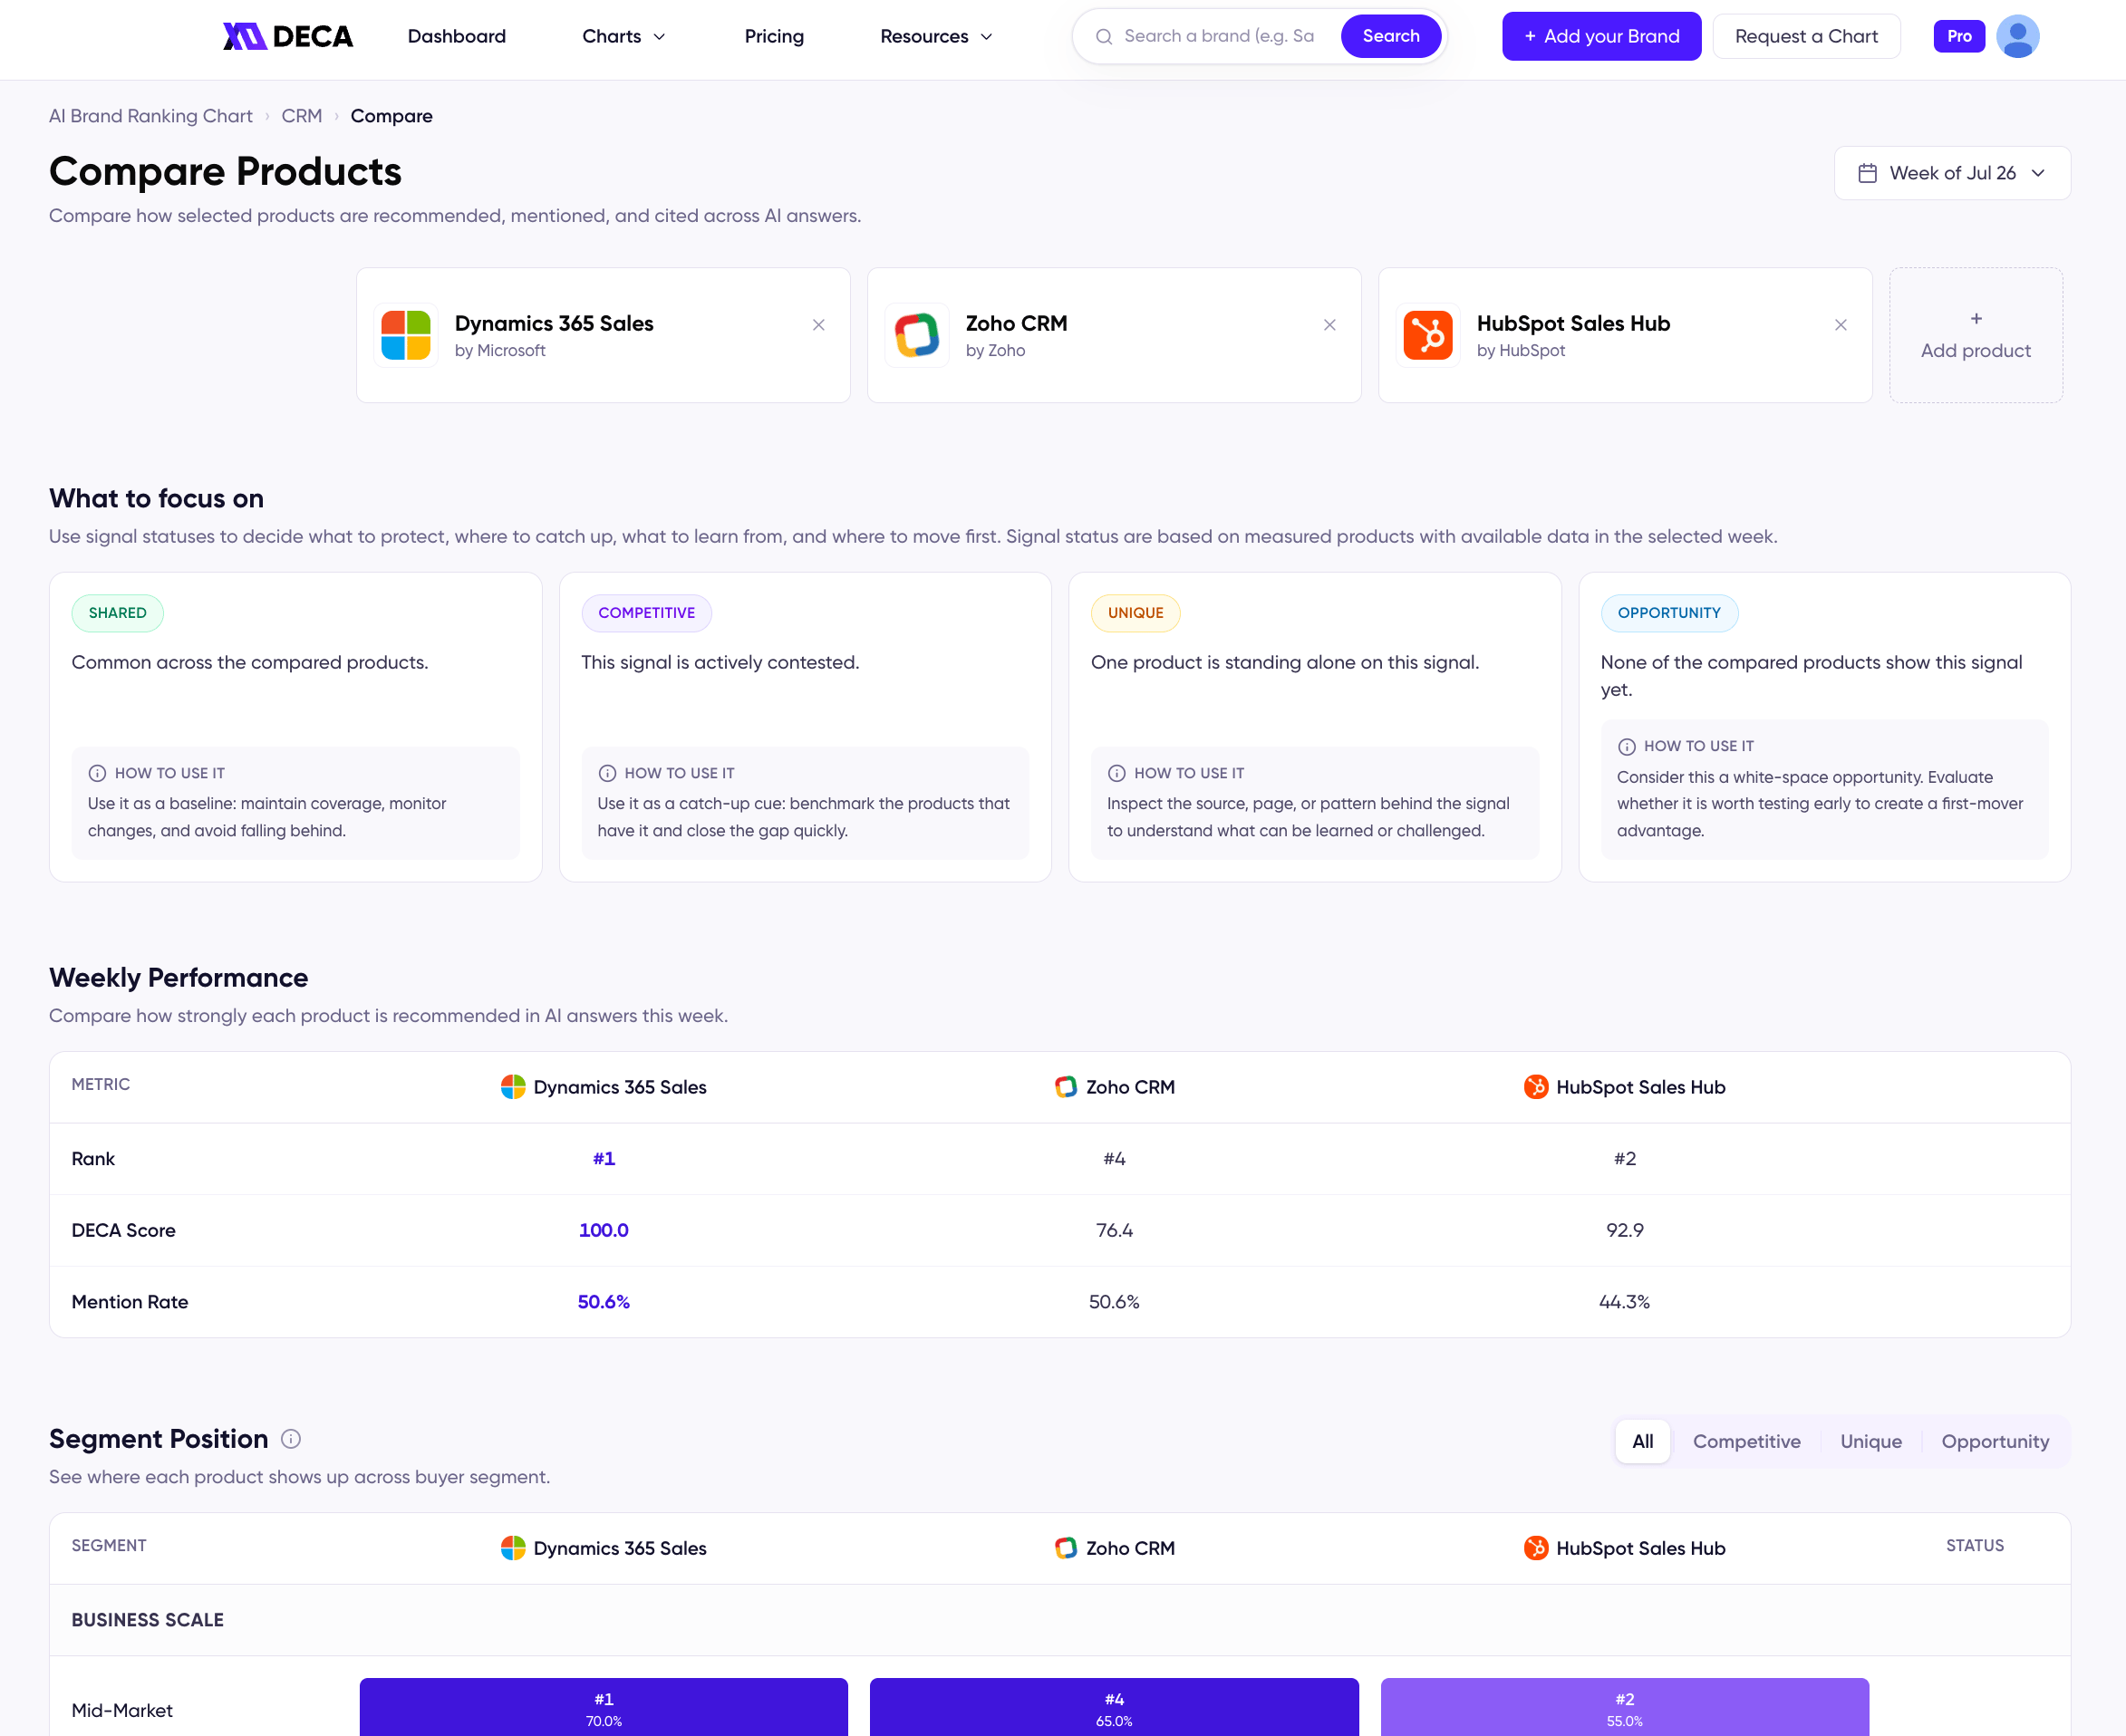
Compare Products with three products side by side
The four signals
Compare doesn’t just show the numbers — every row is tagged with a signal status, so you know what to do with it:
Each section has its own status filter — pick a signal to narrow the view to just the rows that match.
The four views
- Weekly Performance — Rank, DECA Score, and Mention Rate side by side, with the leader in each row highlighted.
- Segment Position — each product’s rank and mention rate in every buyer segment, color-coded, so you spot who’s strong where — and the segments no one has locked down yet.
- Off-Page Citations [Pro] — which external source types AI cites for each product, and whether each product appears in the category’s citation sources, right down to the cited URLs.
- On-Page GEO Patterns [Pro] — whether each product’s most-cited pages carry the content, metadata, and technical signals AI tends to favor, signal by signal.