

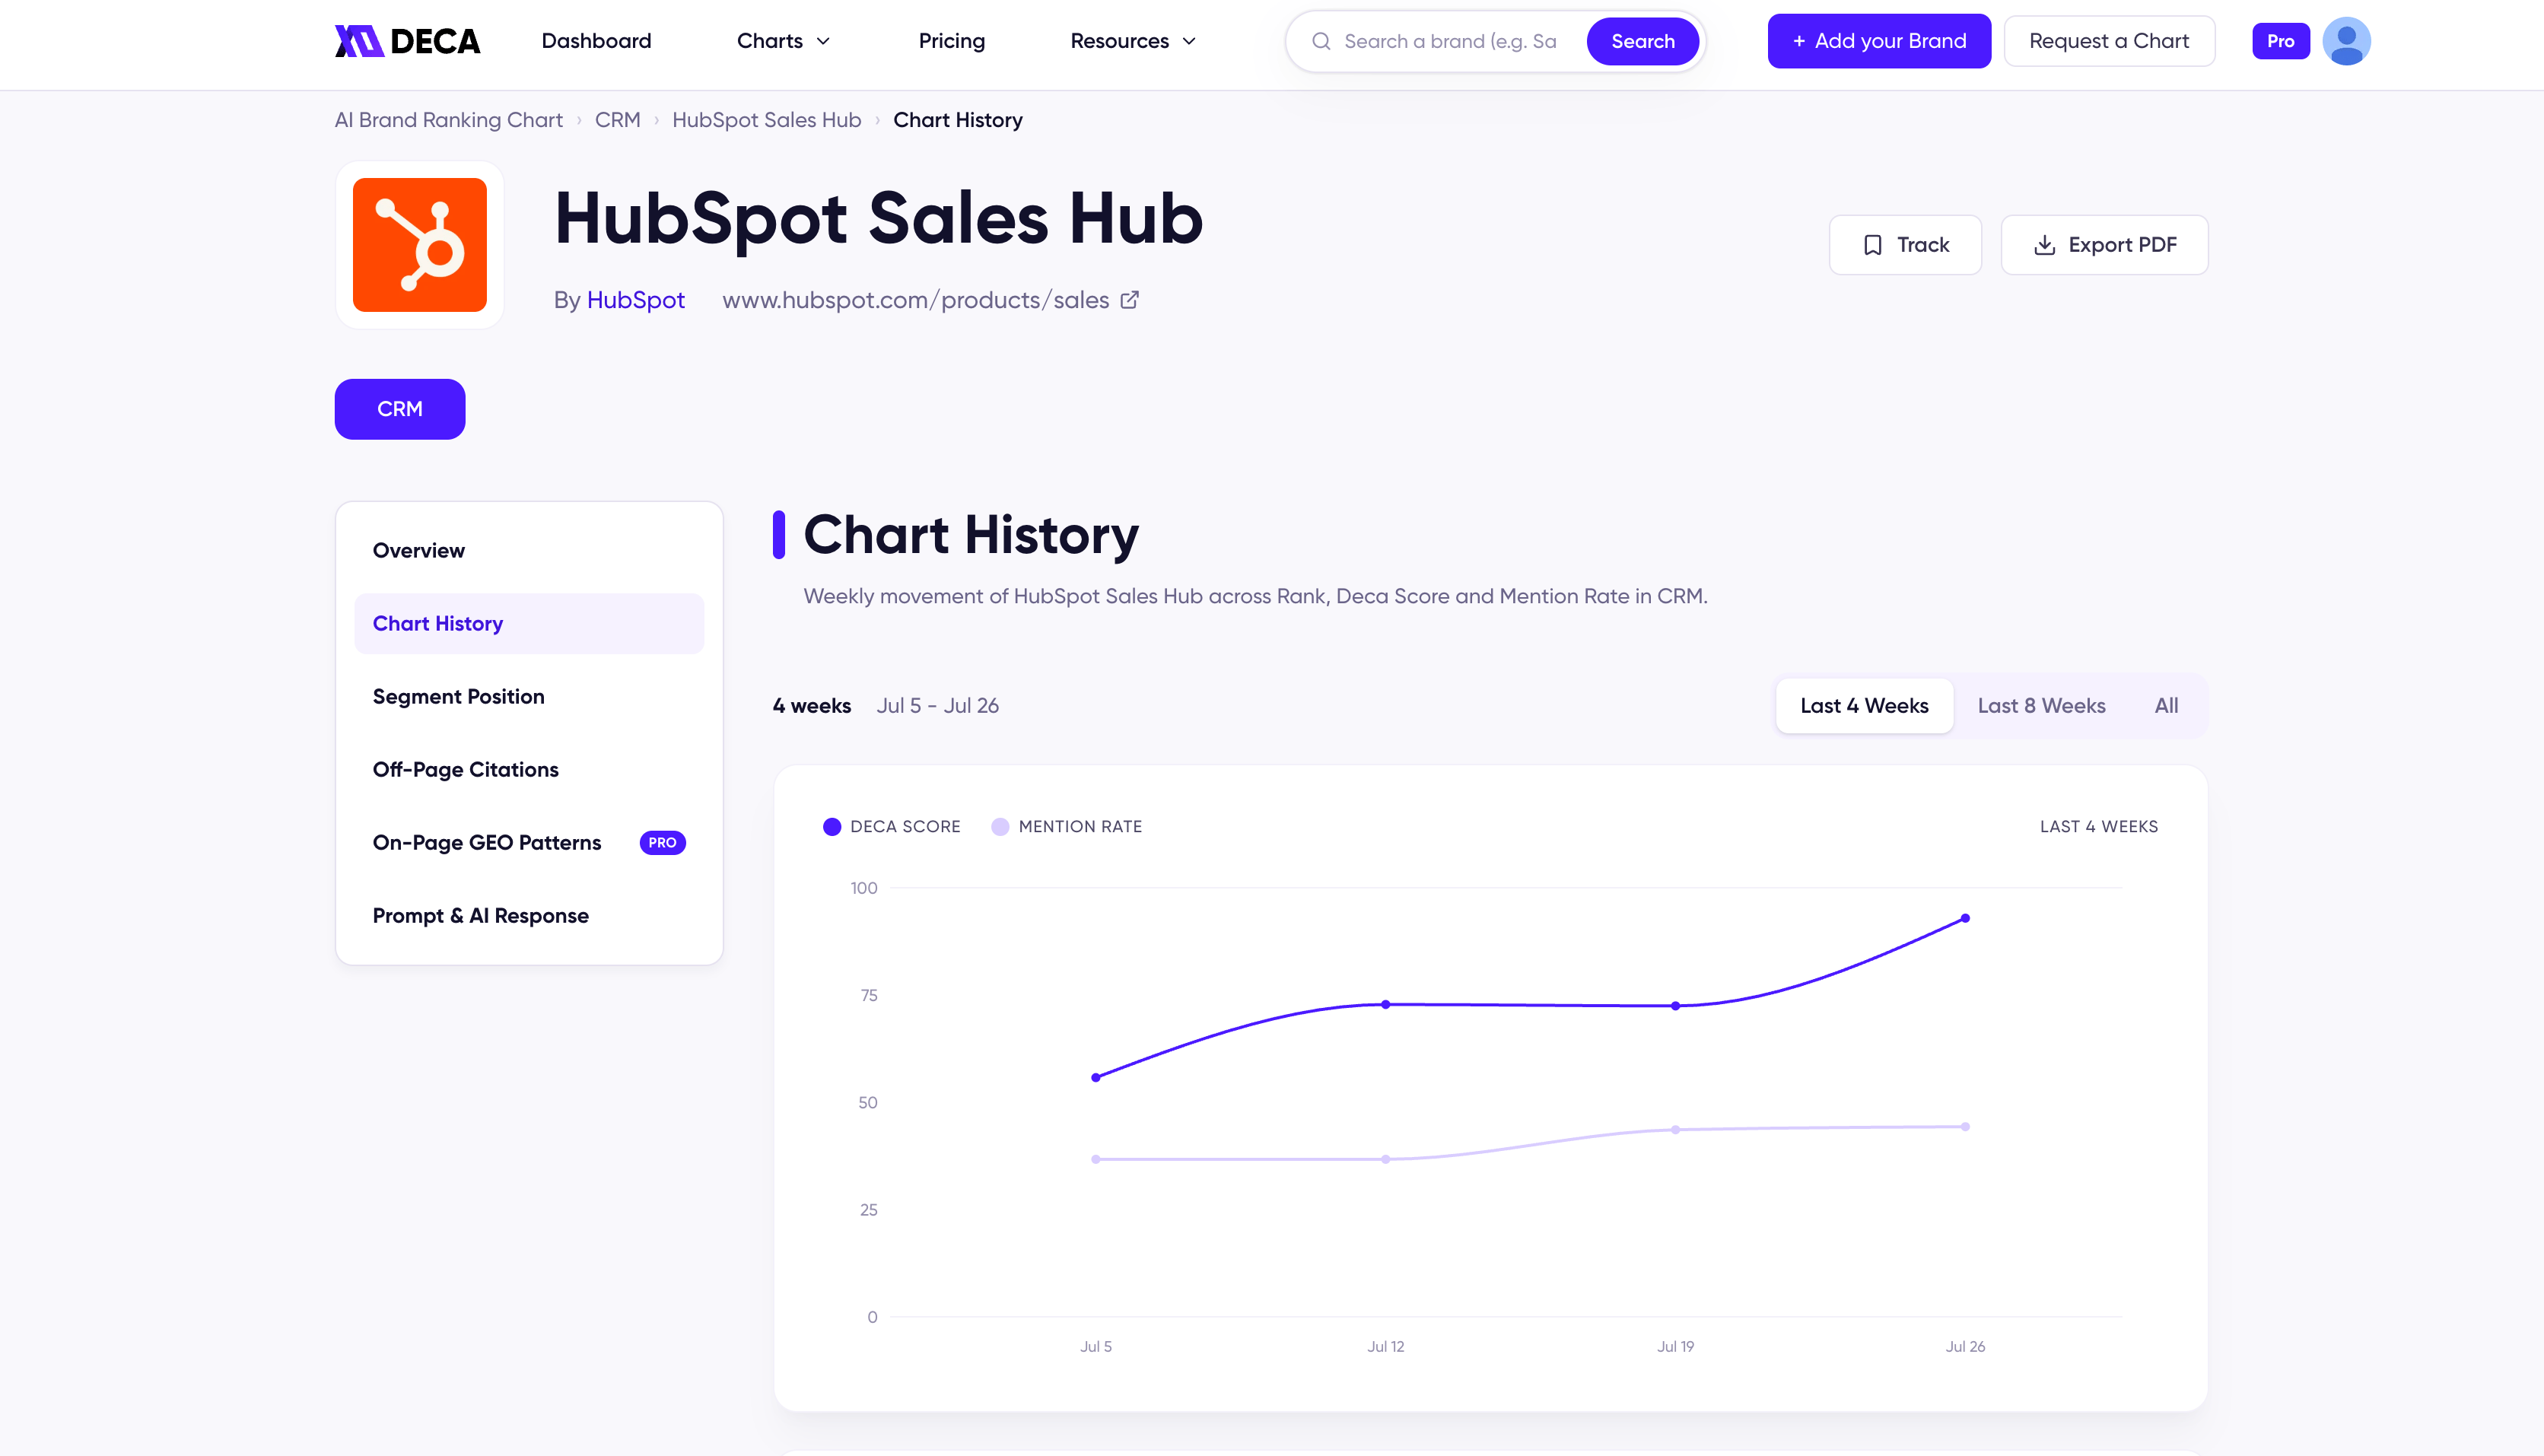
Chart History for a ranked product
The movement chart
Pick a range — Last 4 Weeks, Last 8 Weeks, or All — and the chart plots DECA Score and Mention Rate week by week across it.The weekly table
Below the chart, every measured week is a row with the exact numbers behind the lines:- Week — the collection week.
- AI Platform — the engine and the exact model version that measured that week (e.g. ChatGPT, gpt-5.6-terra).
- Rank, DECA Score, and Mention Rate — each with its change from the week before.