

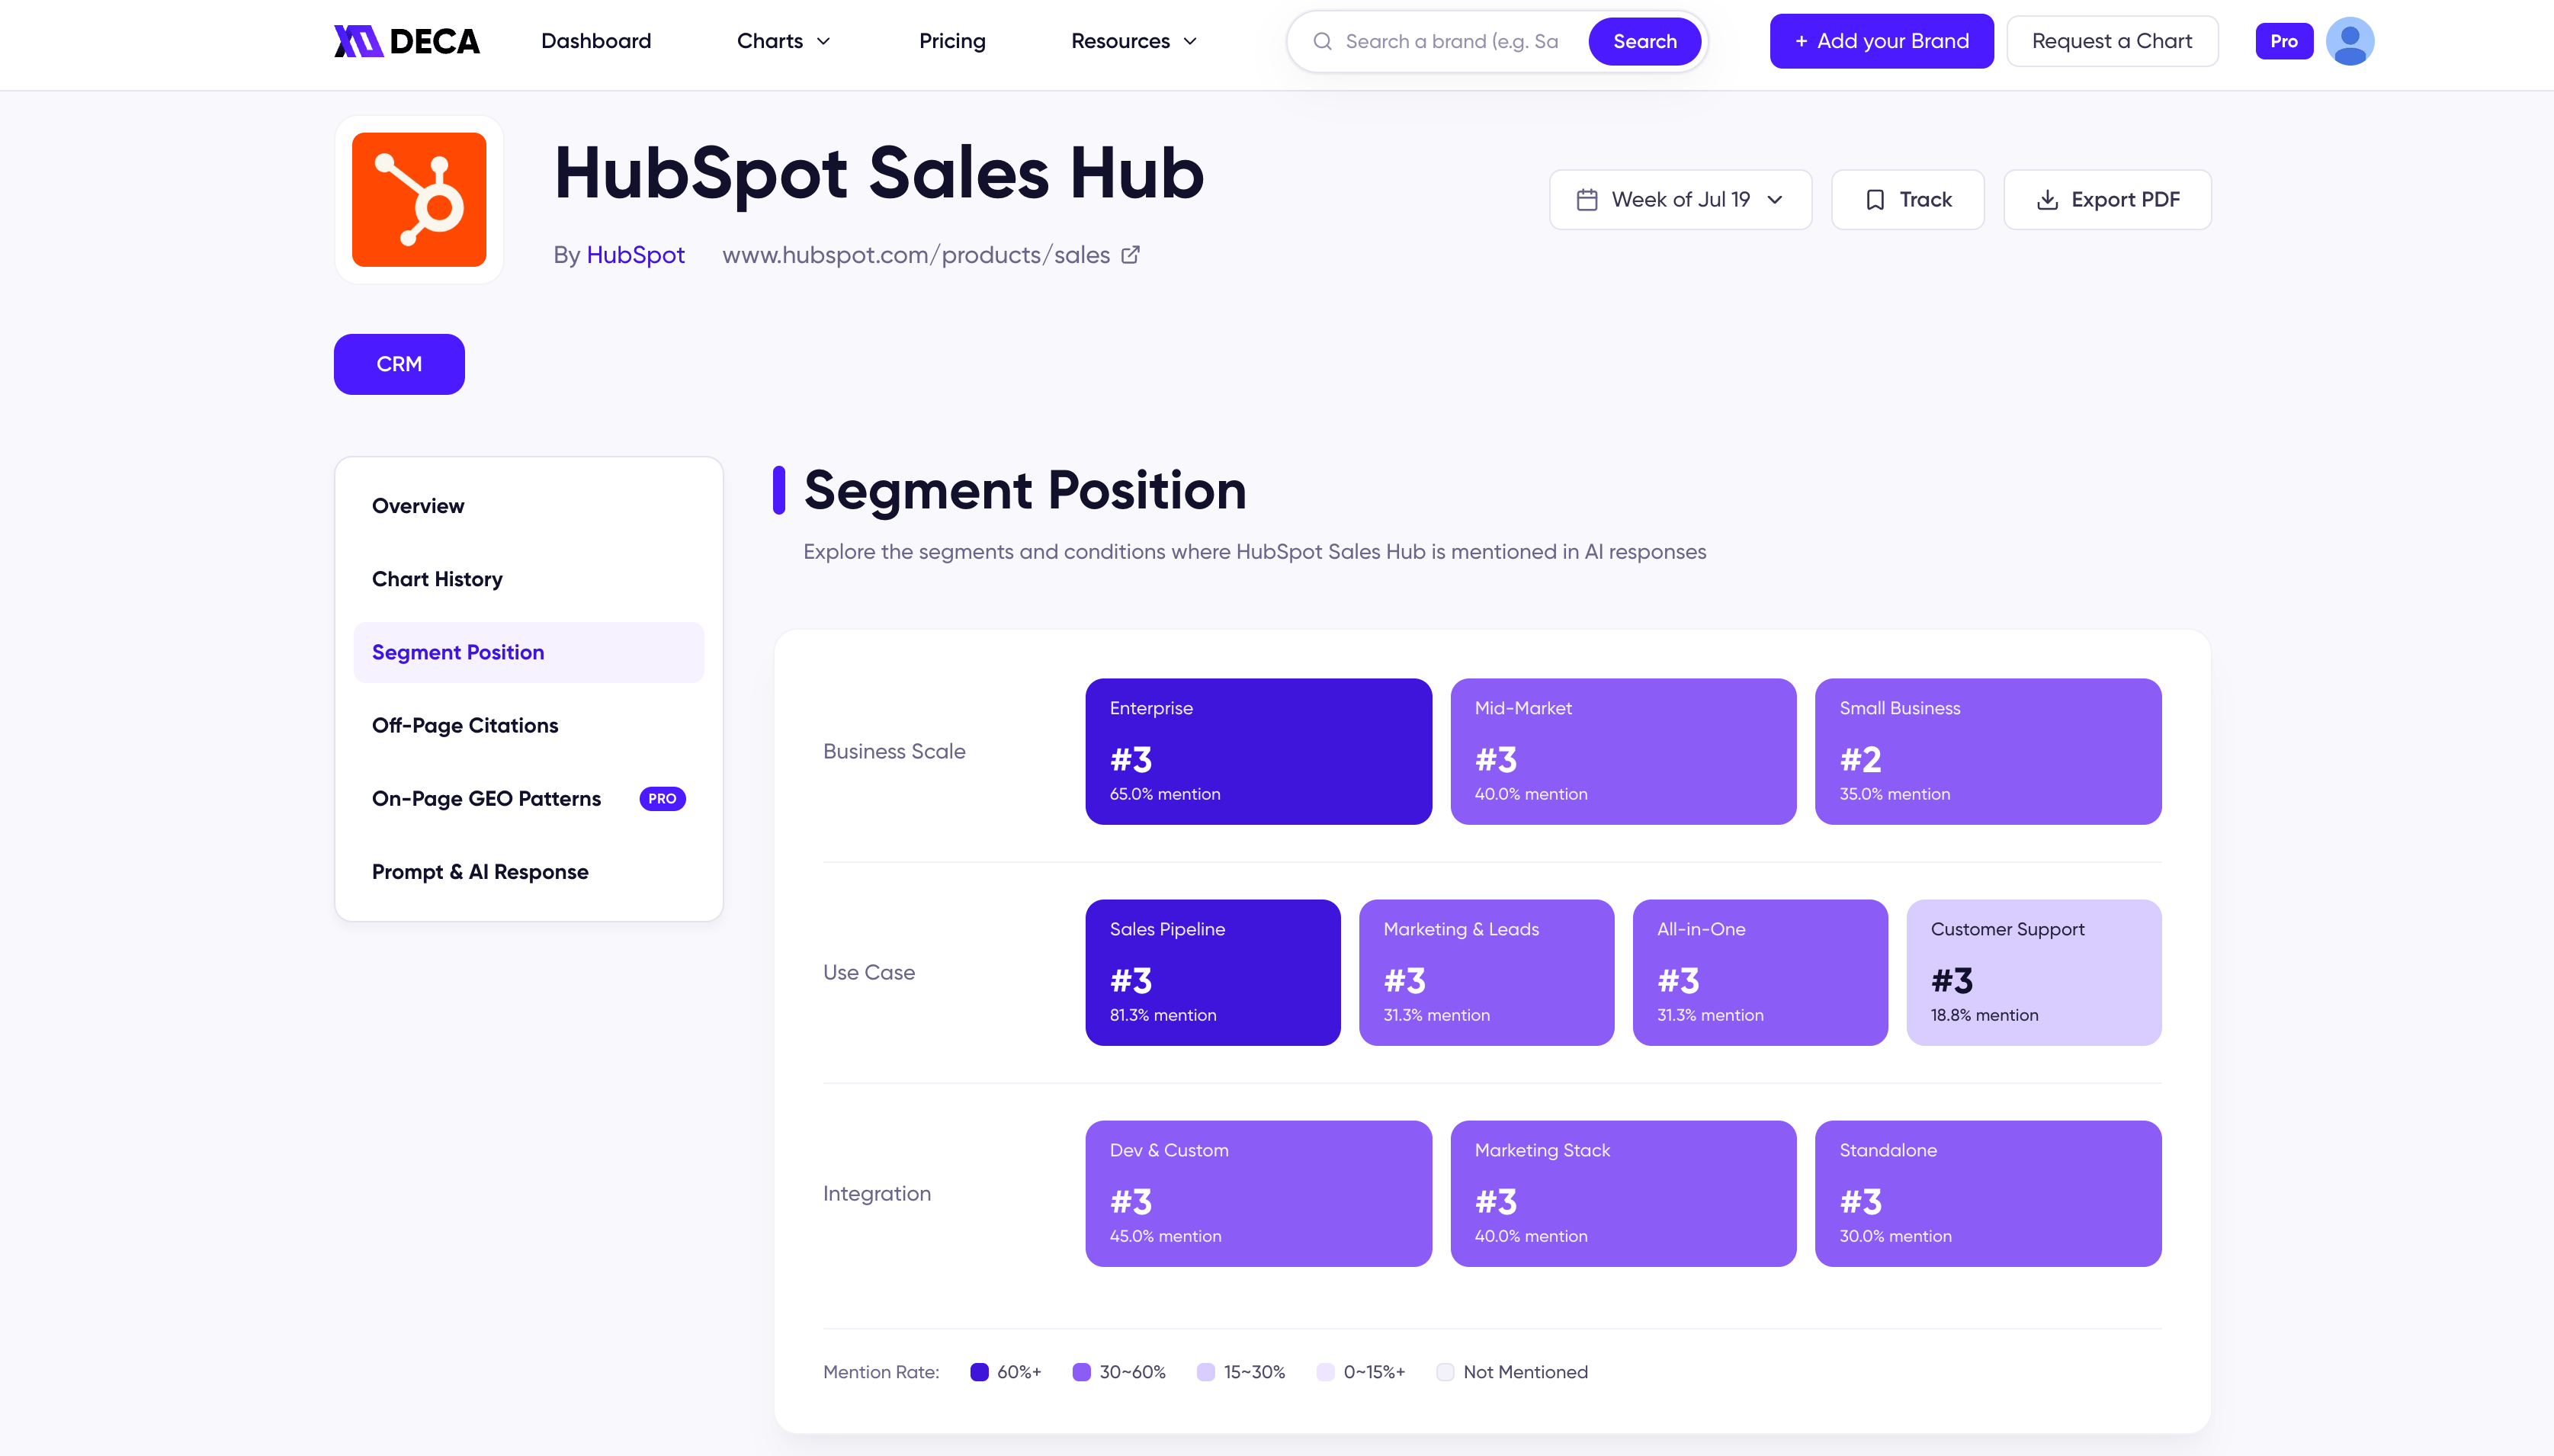
The Segment Position tab shows every segment where a product appears in AI responses — and where it ranks in each. This is the per-product view of the metric; for what a segment is and how segment ranks are computed, see Segment Position in Metrics.
Segment Position tab with segments grouped by condition axis

Segment Position for a ranked product

The segment grid

Segments are grouped by the category’s condition axes — the CRM chart, for example, groups them by business scale, use case, and integration. Each card is a segment the product is mentioned in, showing:
  • the product’s rank within that segment
  • its mention rate among that segment’s responses

Reading the colors

Cards are color-coded by mention rate, from the deepest shade down to Not Mentioned — the legend below the grid shows the bands. One scan tells you where the product is strongest, where it barely registers, and which segments it hasn’t entered at all.